Ensuring smooth operations is no small feat, whether you’re in charge of application performance, IT infrastructure, or business processes. Chances are, you’re a seasoned expert who visualizes meticulously identified key metrics across several sophisticated charts. Your trained eye can interpret them at a glance, a skill that sets you apart.
However, your responsibilities might change or expand, and you need to work with unfamiliar data sets. The market is saturated with tools for building eye-catching dashboards, but ultimately, it comes down to interpreting the presented information. This is where Davis AI for exploratory analytics can make all the difference.
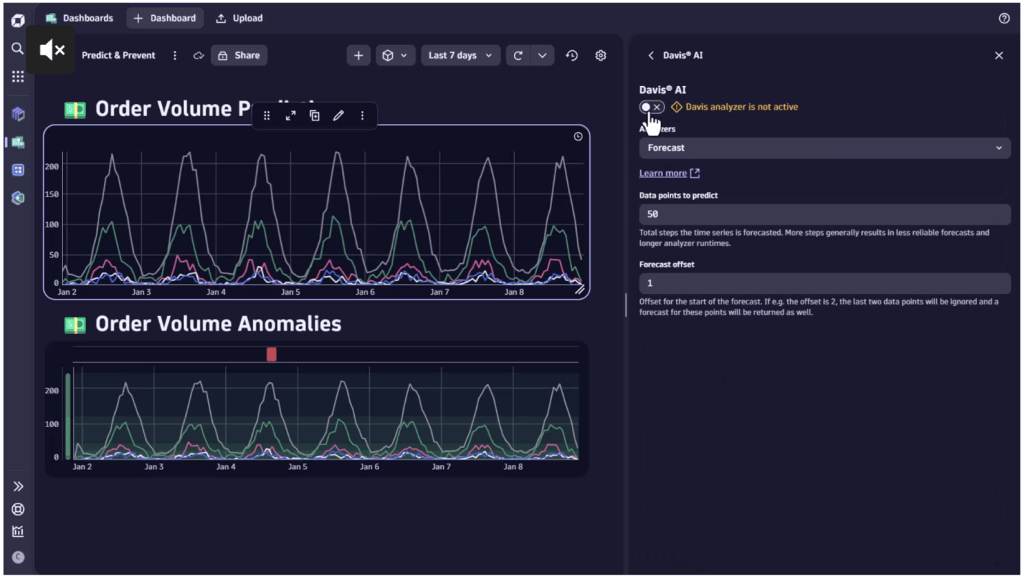
Figure 1. Activate Davis AI to analyze charts within seconds
Dynatrace
Davis AI can help you expand your dashboards and dive deeper into your available data to extract additional information. Our customers value the nearly unlimited possibilities for querying and joining data on the Dynatrace platform, with the option of instant, real-time visualization of query results. Whether you’re an expert or an occasional user, our recently launched Davis CoPilot will enable you to get instant results without the need to write complex queries yourself. Have a look at our recent Davis CoPilot blog post for more information and practical use cases.
If you’ve already created your dashboards, now is the time to use Davis AI to identify anomalies or predict future trends without restricting use cases.
Leverage Davis AI for anomaly detection and instant insights
“My chart shows a peak at 8:00 AM. Do I need to investigate this further?” You might be regularly confronted with this or similar questions. Davis AI machine learning capabilities will help you identify actual anomalies within seconds, enabling you to focus resources on issues that matter.
Based on your requirements, you can select one of three approaches for Davis AI anomaly detection directly from any time series chart:
- Auto-adaptive threshold: This dynamic, machine-learning-driven approach automatically adjusts reference thresholds based on a rolling seven-day analysis, continuously adapting to changes in metric behavior over time. For example, if you’re monitoring network traffic and the average over the past 7 days is 500 Mbps, the threshold will adapt to this baseline. An anomaly will be identified if traffic suddenly drops below 200 Mbps or above 800 Mbps, helping you identify unusual spikes or drops.
- Seasonal baseline: Ideal for metrics with predictable seasonal patterns, this option leverages Davis AI to create a confidence band based on historical data, accounting for expected variations. For instance, in a web shop, sales might vary by day of the week. Using a seasonal baseline, you can monitor sales performance based on the past fourteen days. An anomaly is identified if sales on a Friday are significantly lower than on previous Fridays, indicating a potential issue.
- Static threshold: This approach defines a fixed threshold suitable for well-known processes or when specific threshold values are critical. For example, if you have an SLA guaranteeing 95% uptime, you can set a static threshold to alert you whenever uptime drops below this value, ensuring you meet your service commitments.
Davis AI is particularly powerful because it can be applied to any numeric time series chart independently of data source or use case.
The following example will monitor an end-to-end order flow utilizing business events displayed on a Dynatrace dashboard. By leveraging Davis AI anomaly detection, we can identify potentially fraudulent behavior by activating anomaly detection on the Average order size chart. As shown in the chart below on the lower left, most values fall within the band of acceptable response time (highlighted in green), with only one spike occurring at 5:00 AM. Since this spike was outside the expected range, an anomaly was identified.
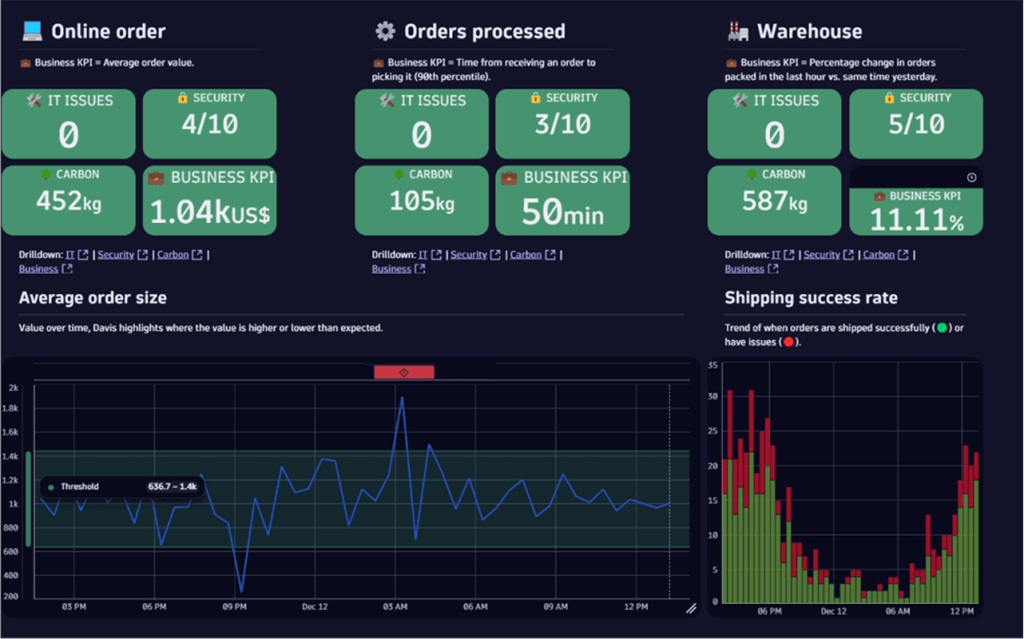
Figure 2. Apply Davis AI anomaly detection to detect fraudulent behavior in a business process
Dynatrace
- Application observability: Identify unexpected error rate increases in application performance, helping pinpoint and resolve issues quickly.
- Digital experience management: Monitor user interaction patterns to spot anomalies in website or app performance that could affect user experience, such as slow page load times.
- FinOps: Track irregularities in cloud spending or resource usage, enabling cost optimization and preventing budget overruns.
Forecasting: Visualize trends directly on your charts with Davis AI
Davis AI forecast analysis predicts future numeric values of any time series. It can even process external datasets or the results of any data query if it can be displayed as a numeric time series, such as occurrences over time.
The forecast is created instantly, even for large data sets, and updates dynamically whenever filter settings are changed.
In application performance management, acting with foresight is paramount. Maintaining reliability and scalability requires a good grasp of resource management; predicting future demands helps prevent resource shortages, avoid over-provisioning, and maintain cost efficiency.
On this SRE dashboard, we utilize Davis AI to forecast and visualize future resource utilization:
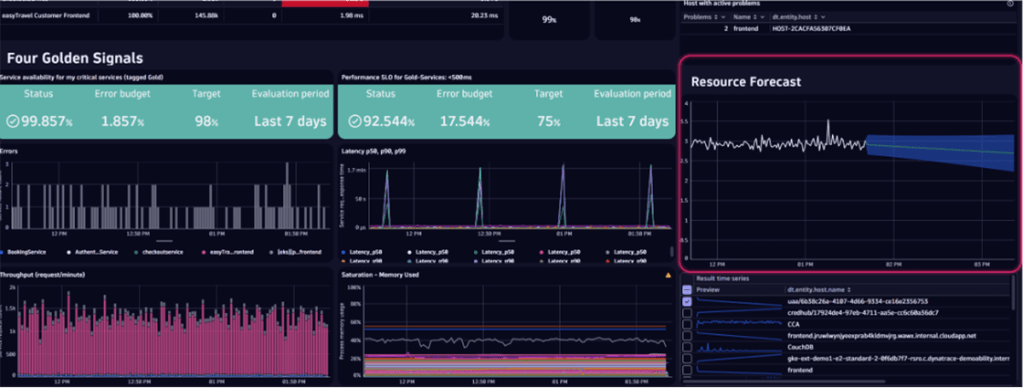
Figure 3. SRE dashboard monitoring the four golden signals and forecasting resource utilization
Dynatrace
Other potential applications for forecasting include:
- Kubernetes: Forecasting helps dynamically scale Kubernetes clusters by predicting future resource needs. This ensures optimal resource utilization and cost efficiency. Forecasting can identify potential anomalies in node performance, helping to prevent issues before they impact the system.
- Business: Using information on past order volumes, businesses can predict future sales trends, helping to manage inventory levels and effectively plan marketing strategies.
AIOps: Utilize Davis AI to predict and prevent
Utilizing the Dynatrace AutomationEngine, Davis AI forecasting capabilities can even trigger automated actions. One of our customers’ SRE teams needed to increase disk space to avoid ongoing over- and under-provisioning, which was time-consuming and annoying. Now, with Davis AI forecasting capabilities, the target disk size is predicted automatically, and an automated task for disk resizing is triggered when necessary.
If you want to further explore the possibilities for prediction and prevention management with Dashboards, have a look at our example dashboard in the Dynatrace Playground.
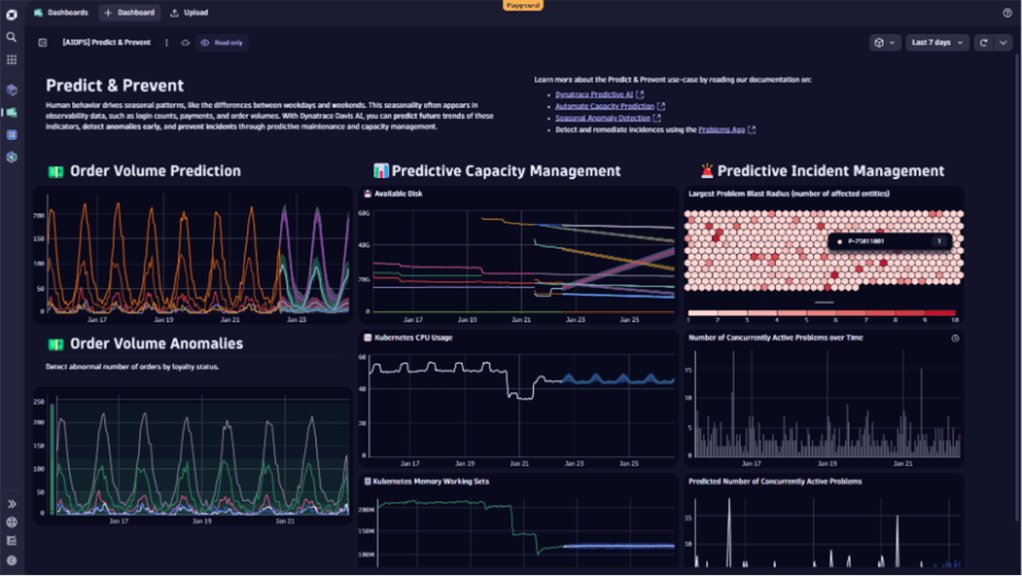
Figure 4. Prevent incidents through predictive maintenance and capacity management
Dynatrace
To explore the depth of functionality of Dynatrace Dashboards yourself and get first-hand experience, try out the app in the Dynatrace Playground.
Read More from This Article: Better dashboarding with Dynatrace Davis AI: Instant meaningful insights
Source: News