Let me begin the dashboard journey. Dashboards were once reporting tools, developed and designed to visualize KPIs and track specific projects or initiatives. I would say that in my organization, as well as most businesses, they played the same role. They were existing and crucial as well, but weren’t mission-critical.
The agile era and digital transformation era followed, marked by increased complexity and velocity of indicators. Even the leadership would like to have live and flexible visibility into their requirements. This is where simple data presentation in visualization (such as the graphs and friendly UX in a static dashboard) isn’t enough.
We need something that can work with our intelligence, something very dynamic and flexible. Leadership doesn’t just want to use it for reporting and monitoring; they want to take one step ahead with data-driven decision making, forecasting, risk and conflict detection and management, and transparency. This is where dashboards have taken many shapes, names and use cases, including operational dashboards, Scrum boards, strategic dashboards, real-time dashboards, tactical dashboards and analytical dashboards.
Now, such a board becomes a lifeline for team meetings, from developers to the C-suite. And that’s when the idea of a strategic control tower was born.
The problem: Data and data sources are visible but not actionable
Our past dashboard setup provided a weekly look at IT project performance. It was developed on top of a traditional BI tool and offered filtered views for various levels, but they weren’t customizable. Mostly market-standard and trending ones.
However, significant challenges included:
- Data delays and sync lags
- Inconsistent formats across systems
- Multiple data sources and lack of real-time data
- No predictive alerts or AI insights.
At this point, we had a dashboard that was a hindsight, whereas I was anticipating foresight. Sometimes, we find out about delays that have already occurred, or that some errors or decisions have already been made. It became clear we weren’t just missing overall live visibility, but we were missing a mechanism.
From dashboard to control tower
We wanted to develop a dashboard for decision-making, more like an air traffic control tower (ATC). An ATC is all about making decisions with real-time events (kind of data). We called it a strategic control tower: not just a fancy dashboard, but a platform connected to all sorts of data and data sources (with data layers, for sure), all user types and processes across functions. And we thought it should be highly customizable.
Its goal is not just to inform, but to empower timely, evidence-based actions. Instead of seeing metrics in isolation, we wanted to:
- Align KPIs with strategic OKRs,
- Unify data from all data sources (IT, finance, HR, procurement and operations)
- Enable live alerts and what-if scenario planning (i.e., conflict alerts)
- Build trust and transparency across stakeholder groups
- Embeds AI to guide decisions — not just present metrics but AI analytics
We didn’t need more graphs and charts in the dashboard; however, we wanted the ability to generate them with just one click. We needed a mission control center that could guide the enterprise through complexity with clarity and agility.
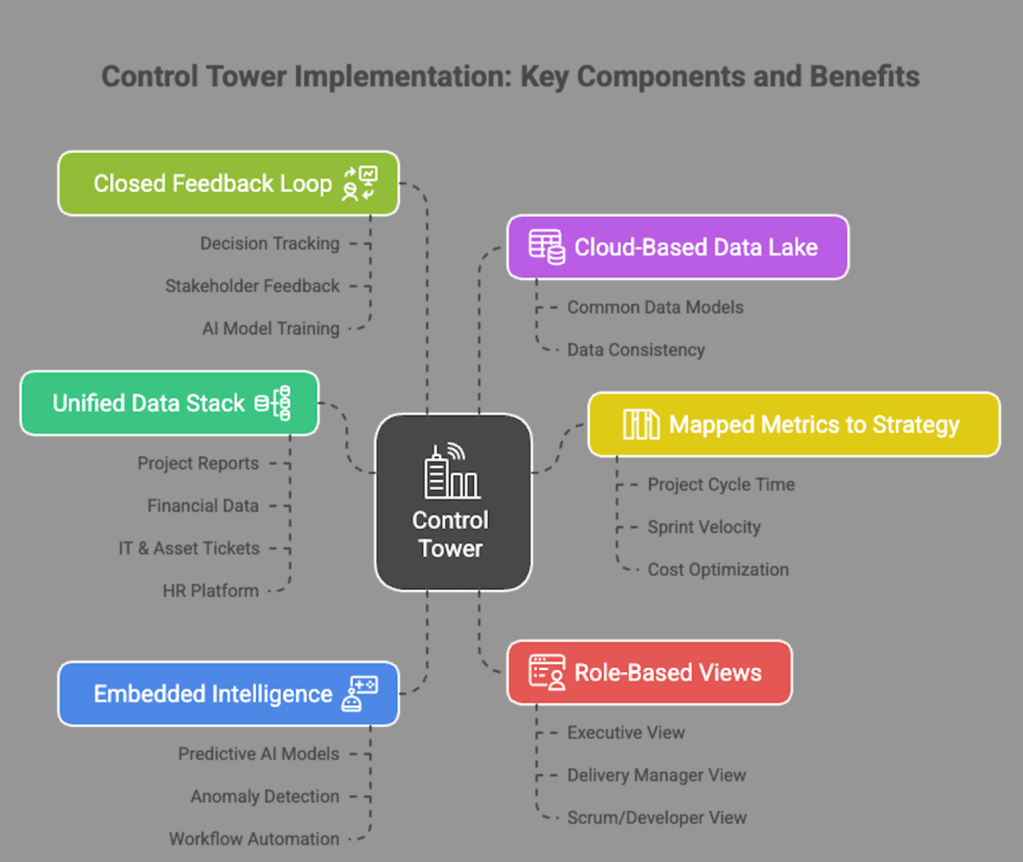
Our transformation journey
- Unified data stack. We have integrated data sources across our systems, like project reports (JIRA), financial data (SAP), IT and asset tickets (ServiceNow), and our HR platform.
- Cloud-based data lake and structured the data using standard data models. Three different layers of data were utilized to ensure consistency in the final layer, thereby facilitating the application of analytics.
- Metrics mapped to strategy. Each tile was aligned with a business objective, such as project cycle time, average sprint velocity across the organization, optimizing cost per application, resource allocation and delivery predictability. We didn’t include vanity metrics and focused on strategic ones.
- Embedded intelligence. The predictive model was a key feature, and total dependency was on data quality and the right AI-trained agent. We incorporated predictive AI models and rule-based logic, utilizing Python and ML, to detect anomalies, budget deviations, delays in cycle time and discrepancies between sprint backlogs and product backlogs, and flag them proactively. These alerts triggered workflows via Power Automate to notify the relevant stakeholders.
- Role-based views. Executives saw a high-level view tied to objectives and key results (OKRs). This personalization ensured relevance, adoption and speed:
- Executives viewed OKR-aligned strategic dashboards
- Delivery managers used execution dashboards
- Scrum teams tracked operational KPIs
- Closed the feedback loop. For me, this was another vital thing to implement. Every decision-making process that happened via this control tower (e.g., realigning a resource, deferring a feature) was tracked and open for the respective stakeholder to comment. Outcomes were fed back into the system to train the AI model and improve recommendations over time for similar decisions and outcomes.
Vivek Singh
Lessons learned
We must understand that, when we undertake a transformation, we’re not trying to alter the technology stake or IT infrastructure. Transformation is about bringing a positive revolution within people, processes and overall to make life easier.
Well, this transformation wasn’t easy for me, but it was certainly deeply satisfying. I had real-time learning, which can be helpful for others:
- The display is nice, but the decision is the final goal. A dashboard shouldn’t just be for reporting and observations, but must provoke actions. I would say even the use of AI must suggest all possible solutions as well.
- Collaboration with end users. Our final success came from stakeholders across IT, business, Finance, HR and operations, not just delivering tech solutions based upon assumptions and learning studies.
- All feedback matters. We rolled out the tower in sprints, learned from each release and expanded scope based on traction.
- Data trust is the top priority. We humans have learned to act on trusted information (data). I spend a considerable time ensuring data quality, validation and transparency.
- Don’t aim for perfection, aim for a working model. I would say, we all know that we should always focus on the active engine of the car. Same here, dashboard data should be live and close to accurate, enough to make dependable decisions.
From reporting the past to orchestrating the future
As I mentioned, transformation isn’t just about a tech stack shift; it’s more about a mind shift towards the goal. Transforming the IT dashboard into a strategic control tower initiative was a significant cultural shift within my organization.
In today’s AI era, business environments must adapt to uncertainty, embrace agility and anticipate frequent changes to remain responsive. Organizations cannot afford to operate with limited indicators and market KPIs. We need real-time intelligence, customizable KPIs, proactive alerts and most importantly, unified visibility across stakeholders. Indeed, the level of authorization is a factor, but all decisions are interdependent.
I recommend minimizing the number of dashboards and having a few strategic control towers. The difference lies not in technology but in intent and execution, from reporting the past to orchestrating the future.
This article is published as part of the Foundry Expert Contributor Network.
Want to join?
Read More from This Article: How I turned our IT dashboard into a strategic control tower
Source: News