Nearly 45% of digital projects encounter challenges that can significantly impact their budgets, deadlines or both, putting organizational success and stakeholder confidence at risk. I found that the most common way for the project status is by reporting methods, whether weekly or monthly updates, often lack the immediacy necessary for timely interventions, and by the time concerns are brought to light, they have typically grown far out of control. However, it is the emergent but promising project rescue strategy, real-time executive dashboards, that is evolving to the rescue.
These live-data visualization tools are interactive, allowing C-suite executives or project managers to gain immediate insight into project health, identify blockers early and dynamically adjust resources as needed. I am sure that real-time dashboards certainly add value to rescue failing IT projects by enabling early intervention through live data visibility, collaborative alignment and automated risk detection despite challenges such as data overload and integration costs. I wrote this article to examine the role of real-time dashboards as a crucial turnaround mechanism for IT project management, including their benefits, limitations and best practices for implementation, using my first-hand experience.
The urgency of real-time visibility in IT projects
IT projects are now complex, involving more than one team, changing customer requirements frequently, customer point of contact changes, end user demands and highly intermingled technologies. Nearly half of these projects are late or over budget, and many of these delays are due to resource shortages or proper alignment that were not identified in time, task dependencies or scope creep. Traditional status reports hinder proactive management, which takes days or weeks after data collection to complete. Real-time dashboards, on the other hand, provide an up-to-the-minute, always-current view of mission-critical project metrics, including progress against the budget, timeline expansions and contractions, resource allocation, risk alerts and quality-driven indicators that support data-aligned decisions.
Drawing on more than 60 empirically analyzed project turnaround cases, I want to explore whether and how quickly the introduction of well-crafted real-time dashboards at inflection points can halt downward trends, usually within 3 months. The improvement is attributed to enhanced transparency, faster problem detection and increased executive empowerment to make informed decisions on changes, such as reallocating resources and escalating issues.
Core features of effective real-time dashboards
What I found is that real-time dashboards are inherently different from reports or matter-of-fact automated reports; they are interactive visualizations of project data, utilizing intuitive graphs, charts, heat maps and progress indicators. They include dynamic, live data feeds that update every few seconds and pull data from a range of sources, such as task tracking systems or financial systems, are included. Users, comprising executives and project managers, can view relevant key performance indicators in a customizable view. Navigation from high-level summaries to detailed task data, allowing users to uncover the root causes of issues, is provided through drill-down capabilities. Centralized collaborative access allows for cross-departmental communication, and automated alerts notify users of critical threshold breaches. These features offer decision-layer visibility and connect data collection with executive action.
| Feature | Description | Benefits |
| Dynamic live data feeds | Continuous updates from multiple sources | Enables instant awareness of project status |
| Customizable views | Tailored dashboards based on user roles | Improves relevance and usability |
| Drill-down capabilities | Ability to explore detailed, task-level information | It helps identify the root causes of issues |
| Collaborative access | Shared platform across departments | Enhances communication and alignment |
| Automated alerts | Notifications triggered by threshold breaches | Promotes timely interventions |
Advantages of real-time dashboards in project rescue
Real-time dashboards provide critical benefits in rescuing an IT project that is failing. By getting immediate access to current data, I can speed up decision-making and identify bottlenecks, delays and budget overruns at their earliest point, enabling swift corrective actions. These dashboards bring together a variety of stakeholders — including developers, QA, finance, and executives — around shared information that keeps everyone focused on the same, transparent data, tying team efforts to organizational objectives.
Our managers and tech leads can gain visibility into workload distribution, prevent burnout and control costs. Continuous risk monitoring enables the identification and proactive mitigation of risks while automating data collection alleviates the manual reporting burden from the team, freeing up resources to perform higher-value work.
Vivek Singh
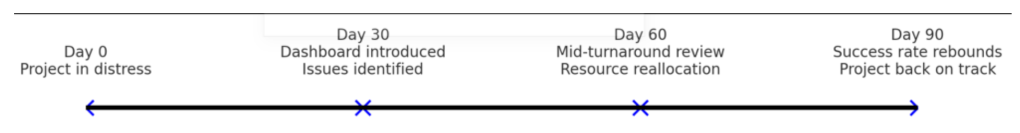
Visual depiction of project performance improvement following dashboard deployment, illustrating early intervention points and rapid recovery phases.
Challenges and considerations in implementation
Despite their apparent advantages, organizations face several challenges in maximizing the effectiveness of their dashboards. Teams struggle to process excessive data, so it is crucial to choose and highlight the right metrics to stay focused on what projects are meant to achieve, thereby avoiding analysis paralysis. Organizations should prioritize KPIs in collaboration with stakeholders, focusing on metrics that drive key decisions. Employ features like filters and alerts to highlight critical issues while minimizing distractions.
The complexity of integrating data sources into these dashboards, which often include legacy and siloed systems, typically necessitates the use of powerful middleware and APIs, resulting in significant initial and ongoing costs for small- to medium-sized enterprises. It raises security and privacy concerns, necessitating strict controls and encryption to protect sensitive information.
Lastly, without proper training and cultural acceptance, dashboards risk underutilization, emphasizing the need for user-centric design and continuous feedback to enhance adoption and usability.
Best practices for adoption
In my experience, best practices for adopting real-time dashboards begin with a phased implementation, starting with critical KPIs and gradually expanding dashboard features. Early stakeholder engagement is crucial for defining relevant metrics and ensuring the dashboard meets user needs. Providing hands-on training and ongoing support helps users become proficient and confident with the tool. Continuous iterative improvement based on user feedback ensures that the dashboard evolves effectively over time. Finally, establishing a governance framework with clear policies on data quality, security and regular update cycles maintains the dashboard’s reliability, security and long-term effectiveness within the organization.
Leading tools supporting real-time project dashboards
Based upon my experience, a few advanced tools facilitate real-time project analytics, each offering unique capabilities:
| Tool | Key Strengths | Suitable For | Real-Time Data Support |
| Microsoft Power BI | Comprehensive BI and customization | Enterprises, executives | Yes |
| Tableau | Advanced visualization and analytics | Data analysts, PMs | Yes |
| Jira Software | Agile project tracking and reporting | Software teams | Yes |
| Asana | Task and timeline tracking | Collaborative teams | Yes |
| Google Data Studio | Free, integrates Google ecosystem | Small to medium projects | Yes |
| Smartsheet | Workflow automation and project tracking | Cross-functional projects | Yes |
Some examples
Industry-wide, real-time dashboards have delivered pivotal success in turnarounds. A global e-commerce company utilized dashboards to monitor website traffic and sales funnel metrics, enabling them to quickly respond to changing customer behavior. As a result, they saw a 20% increase in conversion rates and a significant revenue boost within three months.
These capabilities are critical in rescuing failing IT projects, as demonstrated by substantial improvements often realized within 90 days of dashboard adoption. A manufacturing firm tracked machine performance, detected bottlenecks early and took proactive maintenance steps, resulting in a 15% increase in output and a reduction in the cost of delays.
Likewise, a hospital introducing new patient management software employed dashboards to monitor adoption and reduce error rates by 25% within two months. This approach quickly addressed training issues, ensuring the shift proceeded smoothly and care continued uninterrupted while promoting staff satisfaction.
A new approach to avoiding pitfalls
By offering instant, actionable insights to decision-makers, real-time dashboards mark a new approach to avoiding the pitfalls of failing IT projects. By delivering continuous visibility into project status, resource allocation, risks and project financial health, such tools enable executives and project managers to step in and intervene early and decisively.
The benefits of using these APIs to accelerate turnaround times and enhance collaboration are profound; however, the implementation challenges of data overload and security need to be effectively managed. As IT projects continue to become more complex and dynamic, the real-time deployment of strategic dashboards will become vital to organizations that want to succeed with their projects and achieve operational excellence.
This article is published as part of the Foundry Expert Contributor Network.
Want to join?
Read More from This Article: The 90-day IT turnaround: Real-time dashboards that rescue failing projects
Source: News