The new analytics mandate is descriptive, predictive and prescriptive in context.
When I meet with CIOs or executive sponsors, one of the first things I do is map out their analytics maturity curve. Too often, organizations conflate dashboards with intelligence. They assume reporting is the endgame, but in reality, it’s just the first step.
To make analytics a competitive differentiator, we must move from descriptive insights to predictive foresight — and ultimately to prescriptive action. Each stage builds on the last, but the value curve steepens dramatically as you climb.
Descriptive analytics: Where most organizations begin — and linger
Descriptive analytics answers the question: “What happened?”
These are your standard reports and dashboard visualizations of historical data showing sales last quarter, NPS trends, operational thoughts or marketing campaign performance. In many ways, descriptive analytics serves as the analytical rearview mirror.
Most companies begin there because it’s familiar, accessible and widely adopted. But it’s also where too many get comfortable. I’ve worked with organizations that had hundreds of dashboards but still couldn’t tell you why churn was increasing or how to reduce it.
What descriptive analytics does well:
- Summarizes historical data quickly
- Enables performance monitoring and KPI tracking
- Provides broad transparency and organizational awareness
Its limitations:
- Tell you what happened, but not why it happened
- It doesn’t help forecast or recommend action
- Often reactive — highlighting issues only after they’ve become costly
- I always caution teams: A beautiful dashboard isn’t a strategy. It’s a symptom of needing one.
Predictive analytics: Turning insight into foresight
Predictive analytics uses historical data and statistical models or machine learning algorithms to answer the question, “What is likely to happen?”
This is where analytics begins to proactively impact decision-making. I’ve seen clients use predictive models to forecast sales pipeline health, identify fraud risk in real-time, or assess which patients are most likely to be readmitted post-discharge.
Benefits of predictive analytics:
- Enables forward-looking planning and prioritization
- Helps reduce churn, forecast demand or predict downtime
- Allows early intervention — before issues become losses
Challenges to adoption:
- Requires clean, well-structured historical data
- Demands cross-functional collaboration (analytics + business users)
- It needs robust testing to ensure model accuracy and fairness
If descriptive analytics help you understand what happened, predictive analytics empower you to anticipate what’s next.
Prescriptive analytics: Moving from knowing to doing
Prescriptive analytics answers the question: “What should we do about it?”
This is where we blend optimization engines, business rules, AI and contextual data to recommend — or automate — the best possible action. Think of the next-best-offer algorithms in e-commerce, dynamic hospitality pricing or logistics route optimization.
What prescriptive analytics enables:
- Optimization at scale, often in real-time
- Data-driven decision-making embedded into operational systems
- Automation of complex trade-offs (e.g., speed vs. cost, risk vs. reward)
Considerations for implementation:
- Requires trust from business user-automated decisions must be explainable
- Often necessitates the redesign of business processes
- Needs governance guardrails to avoid “black box” risk
| Dimension | Descriptive | Predictive | Prescriptive |
|---|---|---|---|
| Purpose | Understand past performance | Forecast future events | Recommend or automate decisions |
| Questions answered | What happened? | What will happen? | What should we do? |
| Business users | Executives, analysts | Strategists, planners | Operators, decision makers |
| Tools used | Dashboards, BI tools | ML models, forecasting tools | Optimization engines, AI agents |
| Data requirements | Historical, aggregated | Labeled, time-series | Real-time, multivariate |
| Examples | Sales trend reports | Churn prediction | Dynamic pricing, route optimization |
Together, these three levels of analytics create a layered capability stack. Descriptive analytics help you see, predictive analytics help you anticipate and predictive analytics help you act. But it’s only when these are linked and embedded into business processes that they create real value.
Common barriers to scaling AI analytics
Despite the massive investments we’ve seen in artificial intelligence, machine learning and enterprise analytics platforms, most organizations still struggle to move beyond the pilot phase. I’ve seen this firsthand across industries — executives are excited, and data science teams build great models, but something breaks when operationalizing those models at scale.
What’s holding us back?
There are several consistent patterns I’ve observed across transformation programs, and they often fall into one of four categories: data quality, data silos, governance gaps and cloud cost sprawl. Each one on its own can derail momentum. Together, they become insurmountable—unless addressed head-on.
Poor data quality: The silent killer of AI initiatives
Let’s start with the barrier often underplayed but most consequential: data quality.
If your models are trained on inconsistent, incomplete or inaccurate data, the results will be flawed — no matter how advanced the algorithm. What’s worse, poor quality undermines trust, and once that’s gone, it’s hard to win back stakeholders.
What do data quality issues look like in the real world?
- Duplicate records of the same customer with different IDs
- Missing fields in order histories, shipment logs or EHRs
- Out-of-date pricing tables or sales rep assignments
- Typing errors, mismatched categories and incorrect timestamps
The takeaway? Garbage IN, Garbage OUT still holds in the age of AI.
Why data quality breaks down:
- Lack of standardized input processes
- No accountability for data stewardship
- Overreliance on manual entry
- Legacy systems that don’t enforce validation rules
How to fix it:
- Introduce end-to-end data profiling and cleansing pipelines
- Assign data stewards by domain (e.g., customer, product, location)
- Monitor quality with dashboards on completeness, accuracy and freshness
- Use AI-based data observability tools to detect anomalies
Prioritize improving the quality of data that feeds your highest-impact use cases, not everything at once. Tie every data cleanup initiative to a specific business outcome.
Data silos and fragmentation
Even if data is high quality, it often lives in silos — scattered across CRMs, ERPs, marketing automation tools, spreadsheets and cloud file shares.
What are some typical situations?
- Customer data in Salesforce, product usage data in Snowflake and financials in Oracle — none integrated
- Regional systems using different naming conventions and field formats
This fragmentation leads to inconsistent definitions, duplication of work and multiple versions of the truth. It also makes model training more difficult and production deployment more complex.
What works:
- Data lake or lake house architectures that unify structured and unstructured data
- Strong metadata tagging and a shared data catalog
- An integration platform (or data fabric layer) to unify access without creating redundancy
Governance gaps
Without clear governance, even clean, integrated data can turn into chaos. Governance challenges I commonly see:
- No consistent data definitions between departments
- No agreed-upon owner for key metrics like revenue or customer lifetime value
- Shadow IT spinning up their datasets and dashboards
These gaps create delays, misalignment and risk. They also erode trust in the analytics team because different groups report different numbers — even when pulling from the same system.
What strong governance includes:
- Shared data definitions published in a business glossary
- A cross-functional data governance council
- A change management process for metric definitions and data structures
- Role-based access controls tied to identity management
Cloud cost sprawl
The final barrier that few expect until it’s too late is spiraling cloud costs.
Analytics workloads — especially ML training and distributed querying — consume significant resources. When unmanaged, costs can double or triple within a year, consuming budgets without delivering proportional value.
Common issues:
- ML dev environments running 24/7 — even when no training is happening
- Unused data assets stored in expensive hot storage
- Dashboards auto-refreshing every 15 minutes, even when the data changes weekly
What I recommend:
- Set up FinOps tagging and reporting on all analytics workloads
- Use autoscaling and spot instances for ML jobs
- Implement tiered storage policies
- Set alerts for unexpected cost spikes or usage anomalies
Bringing it all together
These four barriers — data quality, data silos, governance gaps and cost sprawl — are deeply interrelated. You’ll only get partial value if you address one without the others. But if you address them together, you’ll unlock scale, trust and agility.
| Data quality Symptoms: Duplicates, errors Impact: Poor model accuracy Action: Cleanse, monitor |
Data silos Symptoms: Isolated systems Impact: Conflicting reports Action: Integrate via data lake |
| Governance gaps Symptoms: Undefined ownership Impact: Mistrust, non-compliance Action: Assign stewards |
Cloud cost sprawl Symptoms: Runaway spending Impact: Budget blowouts Action: FinOps, auto-scaling |
Building the foundation: Data democratization and self-service analytics
One of the most powerful shifts I’ve witnessed in analytics transformations isn’t technical—it’s cultural. It happens when an organization moves from relying exclusively on analysts and IT teams for reports to empowering every business user to generate, explore and act on data. That shift is called data democratization, and in my experience, it’s the fastest way to turn analytics from a center of excellence into a center of gravity.
What Is data democratization?
At its core, data democratization means giving every authorized person access to the data they need, in a form they can understand, with the tools to act on it — without waiting for IT.
It’s not about opening the floodgates. It’s about smart, governed access to trusted insights. When done well, it enables frontline workers to make decisions with the same rigor as analysts — because they have the same visibility.
Key enablers of democratization
Three pillars enable safe, scalable democratization: tools, governance and skills.
Self-service tools
Without modern tools, democratization is dead on arrival. Today’s self-service platforms enable business users to slice and dice data, create visualizations and build basic predictive models.
Recommended features:
- Drag-and-drop dashboards (e.g., Power BI, Tableau, Looker)
- Natural language querying (“Show me sales by region this quarter”)
- Embedded analytics within CRMs, ERPs and productivity tools
But access alone isn’t enough. Tools must be intuitive, responsive and tightly integrated into user workflows. Embedding insights into Salesforce, ServiceNow or Microsoft Teams increases adoption far more than giving users another portal to log into.
Governance: Guardrails, not gatekeepers
Democratization without governance creates chaos. People make decisions based on insufficient data or conclude stale reports. That’s why Governance is essential—not as a blocker but as an enabler of trust.
Effective governance includes:
- A central catalog of certified datasets with business definitions
- Role-based access controls that balance visibility and confidentiality
- Data lineage tracking to show where the data came from and how it was transformed
- Audit logs to trace who accessed and modified data assets
Data literacy: The missing multiplier
Tools and governance won’t matter if users don’t know how to interpret data or ask the right questions. That’s where data literacy comes in. Data literacy isn’t about turning everyone into a data scientist. It’s about giving people the confidence and context to use data effectively.
What works:
- Tiered training programs (beginner, intermediate, advanced)
- Internal data champions who mentor peers and curate best practices
- Gamification — recognizing teams that use data to drive measurable outcomes
Benefits of data democratization
When done right, data democratization drives quantifiable outcomes:
- Faster decisions: No more waiting three days for a report
- Greater agility: Teams can pivot based on what they see in real-time
- Higher data trust: People know where data comes from and how to interpret it
- More innovation: Business users can test ideas, run “what if” scenarios and propose experiments
It also frees up data professionals to focus on higher-value tasks like advanced modeling, architecture and governance instead of responding to ad hoc requests.
Democratization is not optional. It’s strategic
I’ve worked with organizations where a single data scientist supported 1,000 employees, and others where every team had a “data translator” embedded in their function. Guess which ones made faster, smarter decisions?
You must first scale access, skills and trust to scale predictive and prescriptive analytics. Data democratization is the bridge between isolated success and enterprise-wide impact.
Predictive and prescriptive analytics in action
For many leaders, predictive and prescriptive analytics still sound abstract. But in my experience, the impact becomes tangible and measurable once the proper use cases are identified and embedded into business processes. These capabilities are no longer theoretical or experimental. They are live, operational and transforming how companies plan, act and serve their customers.
Predictive analytics: Seeing what’s next
Predictive analytics uses patterns in historical data to forecast future outcomes. While the algorithms can vary in complexity, from logistic regression to deep learning, the value lies in what they help us anticipate and prevent.
Here are just a few impactful use cases I’ve seen work:
Customer churn prediction
In telecom, retail banking and SaaS businesses, predictive models assess customer behavior patterns — such as drop-in usage, delayed payments or negative service interactions — and assign a churn risk score. The business can then proactively engage these customers with offers, support or incentives.
Predictive maintenance
Manufacturers and logistics providers use sensor data and equipment history to forecast which machines are likely to fail. Instead of waiting for breakdowns, they schedule proactive maintenance, avoiding downtime and saving money.
Demand forecasting
Retailers, CPG firms and ecommerce platforms rely on demand forecasting to ensure the right products are in the correct location at the right time, avoiding stockouts and overstock.
Prescriptive analytics: Acting intelligently at scale
Prescriptive analytics move us from prediction to decision, applying optimization and recommendation engines to identify the best action based on available data.
Where predictive analytics asks, “What’s likely to happen?” prescriptive analytics asks, “What should we do about it?”
Route optimization in logistics
Companies like UPS and FedEx use prescriptive algorithms to continuously optimize delivery routes, considering distance, traffic, weather and service level commitments. These systems automatically adjust routes in real-time, improving delivery efficiency and reducing fuel costs.
Dynamic pricing and revenue optimization
Airlines, hospitality brands and ecommerce platforms use prescriptive models to adjust pricing based on demand, inventory levels, competitor pricing and customer segmentation.
Next-best action in sales and marketing
Sales and marketing teams use prescriptive analytics to identify the next best offer, channel or timing for customer engagement, driving higher conversion rates and more personalized experiences.
Anomaly detection: The unsung hero
While not always classified distinctly, anomaly detection — a subset of predictive analytics — deserves its spotlight. By flagging unusual patterns or deviations, anomaly detection helps companies identify fraud, security breaches, equipment malfunctions or operational risks early.
Examples include:
- Identifying fraudulent transactions in real-time in banking
- Spotting unusual login patterns in cybersecurity to trigger alerts
- Detecting billing anomalies in utilities or healthcare claims
Embedding analytics into operations
The real power of predictive and prescriptive analytics comes when the models are insightful and integrated. That means daily embedding them into the workflows, systems and decision-making processes.
For example:
- Churn risk scores surface in the CRM so retention teams can act immediately
- Route adjustments push directly to driver mobile apps in logistics
- Pricing changes update in real-time on customer-facing portals
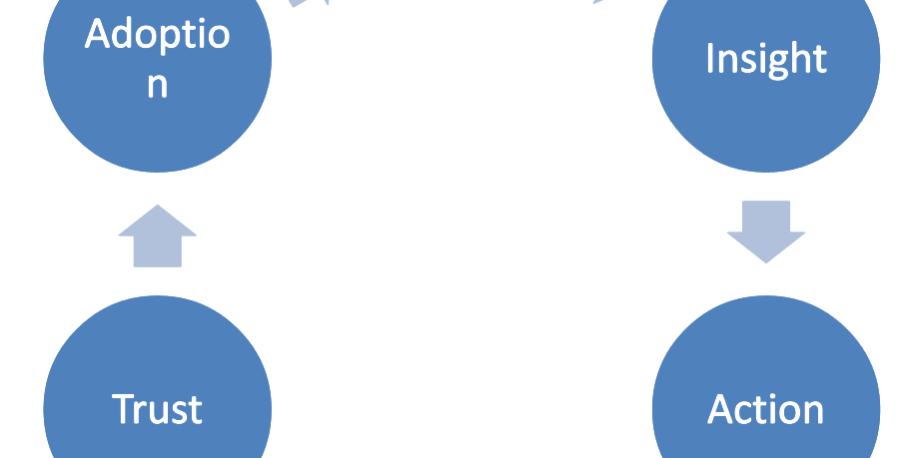
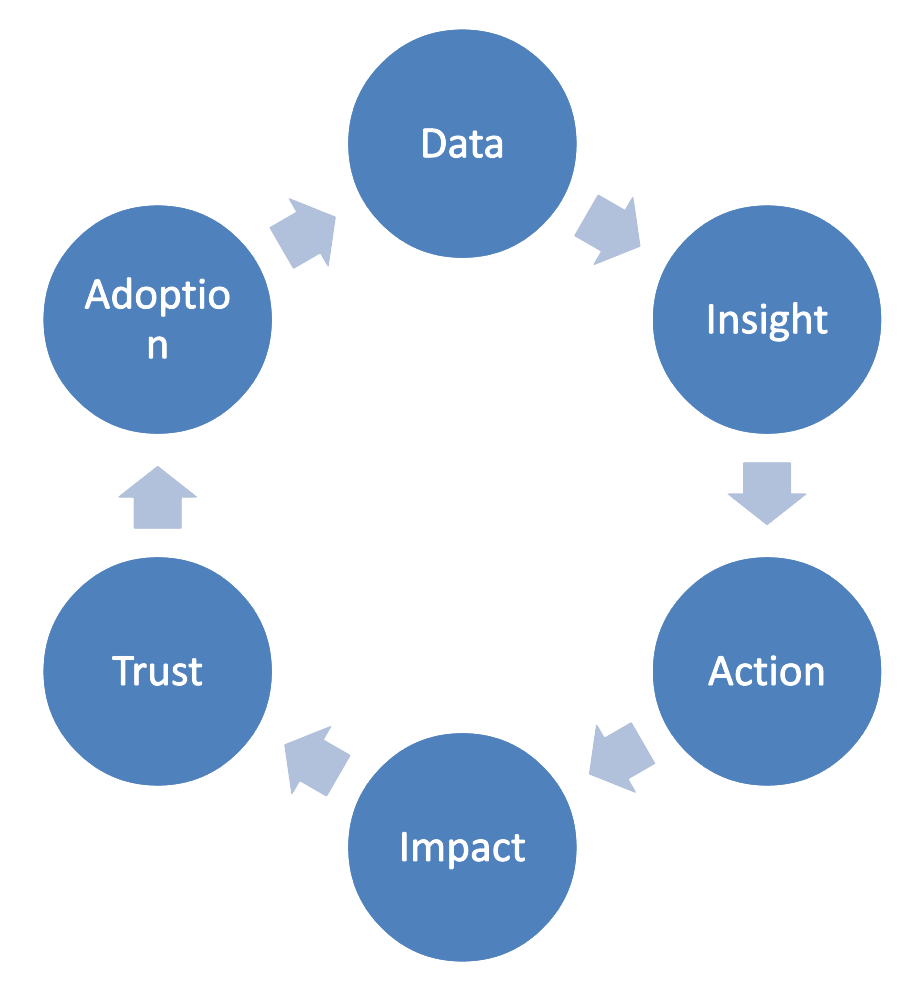
This closed-loop integration ensures that insight becomes action, and that action becomes measurable impact.
I often tell executive teams that if their analytics ends with a PowerPoint deck, they’ve already lost. True predictive and prescriptive analytics don’t just inform decisions; they automate them, optimize them and embed them into the heartbeat of the business.
Proving and communicating analytics ROI to the C-suite
In my experience, the single most overlooked aspect of any analytics initiative is not the technology; it’s the business case communication. Too often, predictive and prescriptive models are celebrated for technical accuracy but fail to win executive buy-in. Why? Because they don’t clearly articulate one simple truth: what business value was created?
If your model increases customer lifetime value, reduces fraud, shortens fulfillment time or saves millions in infrastructure costs, that’s great. However, unless the C-suite sees those outcomes presented in the language of ROI, KPIs and business impact, it will be dismissed as another analytics experiment.
I’ve worked with teams that built brilliant solutions but struggled to prove their relevance. I’ve also helped struggling initiatives gain traction by changing how their value was framed. This section is about doing just that — proving and communicating ROI in resonating ways.
What the C-suite cares about
Executives aren’t looking for model accuracy. They’re looking for business transformation. Here’s what they pay attention to:
Revenue uplift
- Increased sales or upsell rates due to better targeting or personalization
- Higher conversion rates from optimized journeys
- Market expansion based on demand prediction
Cost reduction
- Automation of manual processes (e.g., claims processing, report generation)
- Inventory optimization or supply chain efficiency
- Lower customer service costs due to AI-guided interactions
Risk mitigation
- Improved fraud detection
- Reduced compliance violations or audit exposure
- Minimized downtime through predictive maintenance
Time to value
- Faster time to market
- Shorter product development cycles
- Reduced time to insight or action
These metrics secure funding, drive scale and earn trust.
Frameworks for measuring ROI
The good news? You don’t need a finance degree to prove ROI. You need consistent techniques and a commitment to tie analytics efforts to outcomes.
Baseline vs. after implementation
This is the most straightforward—and often most powerful—method. Measure key metrics before model deployment, then track improvements over time.
Example:
- Before churn model: 20% churn rate
- After churn model + intervention campaign: 15% churn rate
- Financial impact: 5% retained = $8M in annual revenue saved
A/B or control group testing
Run the model in one group or region and keep another as a control. The differential becomes your ROI.
Example:
- Personalization campaign using AI vs. a generic campaign
- AI group: 7% conversion; Control group: 4%
- Lift: 3% = $4.2M in incremental sales over 6 months
How to present analytics ROI to the board
Even if your team measures the right things, you must communicate them effectively. Use business language, not jargon:
- Say, “We saved $500K in fraud losses” instead of, “The model has 94% precision.”
- Say, “The model enables us to intervene 10 days earlier” instead of “We reduced false positives by 18%.”
Visualizing outcomes
Build executive dashboards that show impact, not complexity.
| Metric | Before | After | Value delivered |
|---|---|---|---|
| Churn rate | 18% | 12% | +$6.3M |
| Avg deliver time | 4.2 days | 2.9 days | +Customer NPS + cost savings |
| Forecast accuracy | 65% | 82% | -Inventory costs |
Use bar graphs, trend lines and waterfall charts to show long-term gains.
Tell success stories
Combine numbers with human context. Share how a regional sales team exceeded quota because of AI-led targeting or how supply chain delays dropped after implementing predictive routing.
CIOs must be storytellers — not just technologists.
Analytics as a strategic asset
I make one key recommendation to every CIO: treat your analytics team like a profit center, not a cost center.
That means:
- Tracking value created vs. cost of operation
- Creating internal case studies to socialize wins
- Holding quarterly “impact reviews” alongside financial reviews
Analytics should be viewed as an investment portfolio — each use case has a cost, a potential return and a value realization curve.
No executive expects perfection. But they do expect clarity. If your team can connect data science work to tangible business outcomes — revenue gained, reduced risk and improved efficiency — you’ll sustain your analytics program and expand its influence.
The playbook: Practical steps for CIOs and technology leaders
By this point, you’ve seen the strategic importance of analytics, explored the technology and culture barriers and reviewed how to prove value. But if you’re a CIO or business leader, your next question is probably: “What exactly should I do next?”
You don’t need a multi-year roadmap to get started — you need momentum. That’s why I recommend a 30 to 60 to 90-day plan: a focused, structured way to build a pilot, deliver impact and lay the foundation for scaling.
Below is the complete roadmap, with narrative context and a visual summary in table form.
The 30-60-90-day analytics acceleration roadmap
| Phase | Goals & focus | Key activities | Success markers | Owners involved |
|---|---|---|---|---|
| Days 1–30: Align & assess | Identify high-impact use case and secure sponsorship | Choose 1–2 measurable business problems
Form cross-functional pilot team Audit data availability and quality Define KPIs and success criteria Get business and IT alignment |
Executive sponsor committed
Data sources validated KPIs defined and baselined |
CIO, business lead, data owner |
| Days 31–60: Build & validate | Develop a working model and test assumptions | Clean and prep data
Build predictive or prescriptive model Validate results with test data Develop proof-of-concept dashboard Share early results |
Pilot model ready
Business users engaged Feedback loop active |
Data scientist, analyst, architect |
| Days 61–90: Deploy & scale | Launch into production and plan for enterprise scaling | Embed model into the operational system (e.g., CRM)
Begin live decision-making Track impact vs. baseline Capture lessons learned Draft second-wave case plan |
Measurable ROI shown
Use case live Plan created for expansion |
CIO, business ops, engineering |
Phase 1 (Days 1–30): Align & assess
This first phase focuses on business alignment, not technical implementation. Success here depends on clarity of purpose and data readiness.
Do this:
- Choose a problem that matters (e.g., reduce churn, improve conversion, optimize routing)
- Avoid overly abstract use cases; pick something that affects revenue, cost or CX.
- Align analytics, business and IT leaders around what success will look like
- Conduct a quick data assessment: Do we have the correct data? Is it clean? Who owns it?
- Set KPIs now so you can measure impact later
Phase 2 (Days 31–60): Build & validate
Now, you turn your strategy into execution. You’re not building the perfect model—you’re creating the Minimum Viable Model (MVM) to test feasibility and generate early insight.
Do this:
- Prep and transform the data with the business context in mind
- Use proven tools like Data Robot, Azure ML or Python/SQL in notebooks
- Involving business users frequently — test interpretability and usefulness
- Create a pilot dashboard or embed model scores in a sandbox application
- Runback tests and simulations to estimate business impact
Best practice: Deliver weekly insights and prototypes. Create confidence through iteration, not mystery.
Phase 3 (Days 61–90): Deploy & scale
With the pilot proven, you can now put the model to work. Embed it where decisions are made, track its performance and share early wins.
Do this:
- Launch the model into production workflows (e.g., marketing tools, CRMs, ERPs)
- Train users and integrate feedback loops
- Monitor metrics in real-time — focus on both technical performance and business outcomes
- Document lessons, update assumptions and fix bottlenecks
- Create a roadmap for scaling — reusing code, pipelines and methodology
Critical success factors
To make this playbook work, here are five rules I always emphasize:
- Start small, aim high. Pick use cases that are high-impact but contained
- Business must own the problem. IT builds tools, but value comes when business drives adoption
- Make results visible and visual. Dashboards and charts beat spreadsheets in every exec briefing
- Plan for scale early. Modular models, reusable components and governed pipelines save time later
- Communicate relentlessly. Weekly updates keep momentum; monthly reviews show ROI
Why it works
This approach doesn’t require AI labs or seven-figure budgets. It’s fast, focused and scalable. Most importantly, it builds credibility with the business by linking analytics to outcomes, not just insights.
By Day 90, you’ll have:
- A use case in production
- Executive champions on board
- Lessons learned to inform enterprise scale
- A repeatable model to apply across the organization
From insight to competitive immunity
I want to share a powerful truth I’ve observed across industries and organizations of all sizes: analytics maturity is not a luxury — it’s a competitive requirement. The difference between the companies that thrive in disruption and those that stagnate isn’t simply who has the most data. It’s who can turn that data into action—quickly, repeatedly and responsibly.
Too many organizations treat predictive and prescriptive analytics as an “innovation track,” a separate, experimental playground disconnected from core operations. That’s a missed opportunity. When AI-powered analytics is embedded in how your business functions day-to-day, it becomes a force multiplier — driving decisions faster, aligning strategy with execution and surfacing insights that human intuition might miss.
But analytics doesn’t scale by itself. As I’ve shared throughout this article, it takes executive sponsorship, trusted data foundations, innovative cloud cost management and, most importantly, a culture that sees data as a product, not a byproduct.
From descriptive to decisive
Let’s take a moment to reflect on the journey we’ve mapped:
- Descriptive analytics helps us understand what happened.
- Predictive analytics show us what’s likely to happen next.
- Prescriptive analytics tells us what to do — and increasingly, does it for us.
Together, they create a continuum of intelligence that drives smarter, faster and more agile decisions. The organizations that integrate these layers — not in silos but as part of their operating model — create what I call competitive immunity: the ability to learn, adapt and act faster than the market.
Where we go from here
The next wave of enterprise transformation will be shaped not just by AI, but by the organizations that can operate it across functions. Predictive and prescriptive analytics are no longer bleeding-edge — they’re battle-tested. And if we apply them thoughtfully, with structure and trust, they will redefine how we lead.
Vipin Jain
I’ve seen predictive models guide multimillion-dollar investments, prescriptive routes save millions in transportation costs and anomaly detection protect entire business units from fraud. But I’ve also seen innovative models go unused because stakeholders didn’t trust the data—or didn’t know the model existed.
That’s why I believe our job as CIOs and architects isn’t just to enable analytics—it’s to institutionalize it, to make it inseparable from how our organizations operate, to make “What does the data say?” not an innovation question but a reflex.
The competitive landscape is shifting fast. But if you have the tools, the talent, the trust and the tenacity to scale predictive and prescriptive analytics — there’s no reason your organization can’t lead in the years ahead. Let’s make analytics not just a capability — but a catalyst.
This article was made possible by our partnership with the IASA Chief Architect Forum. The CAF’s purpose is to test, challenge and support the art and science of Business Technology Architecture and its evolution over time as well as grow the influence and leadership of chief architects both inside and outside the profession. The CAF is a leadership community of the IASA, the leading non-profit professional association for business technology architects.
This article is published as part of the Foundry Expert Contributor Network.Want to join?
Read More from This Article: Your data’s wasted without predictive AI. Here’s how to fix that
Source: News